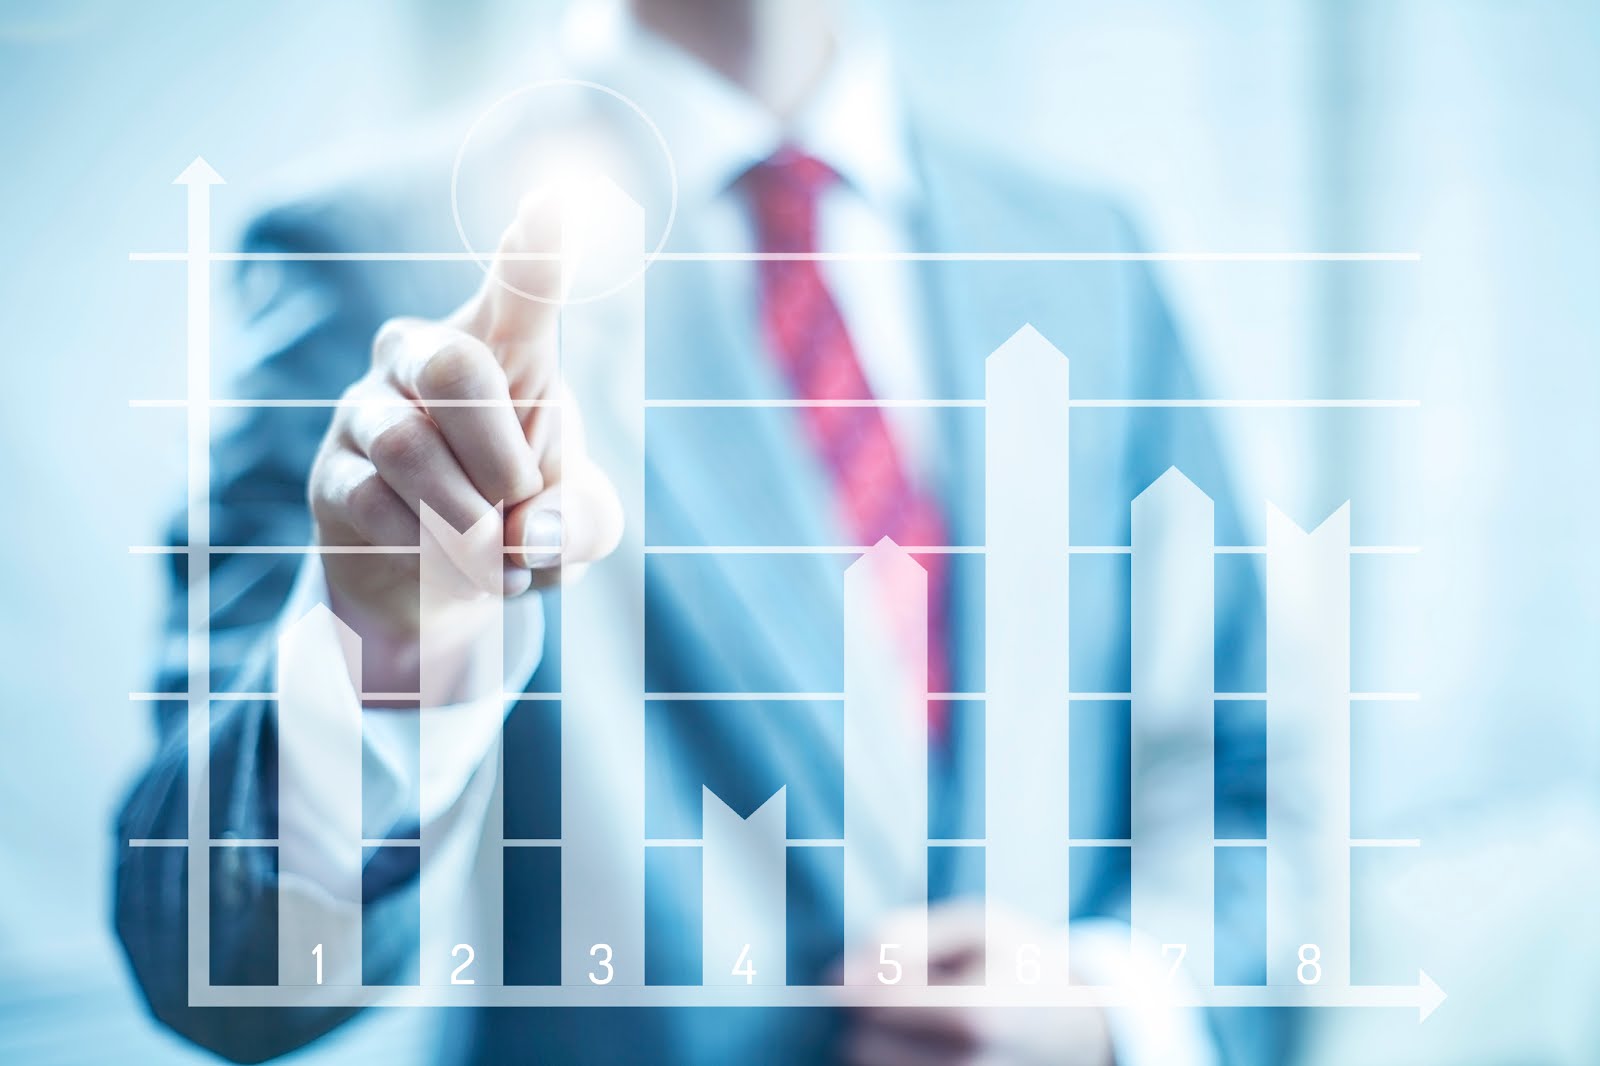
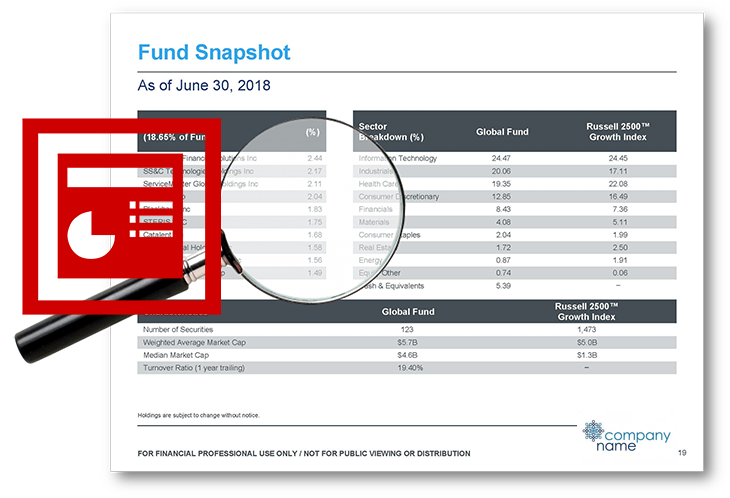
Beautiful, Automated Charts and Graphs
Reduce hours of manual design work to seconds—with zero chart-related compliance errors.
Talk to an Expert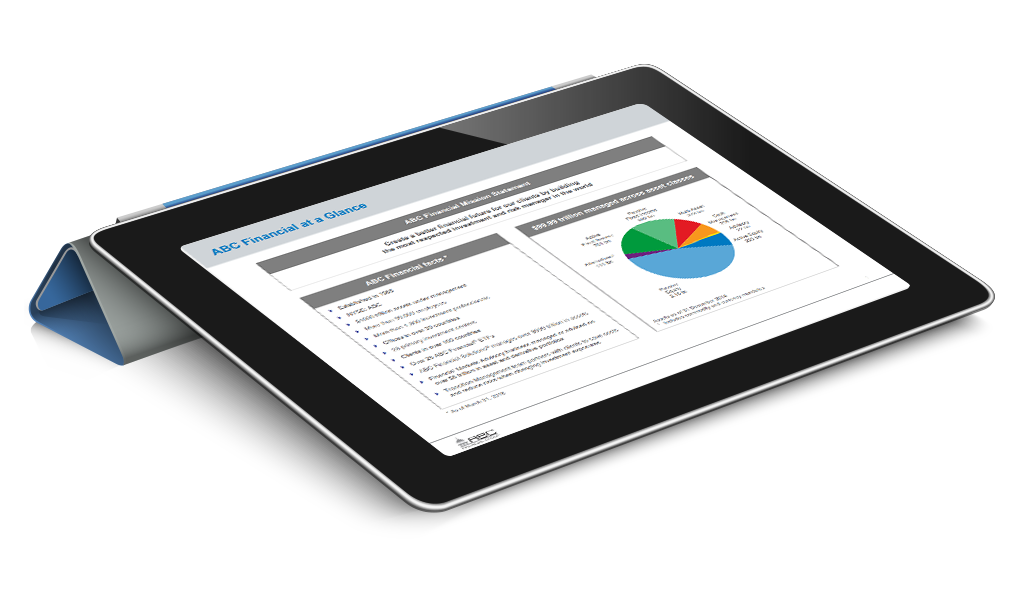
Still Creating Charts & Graphs Manually?
Creating and updating charts and graphs is still a manual, time-consuming process for most asset managers.
Every data change requires rework across multiple documents. Teams rebuild charts repeatedly for fact sheets, pitchbooks, and reports—introducing inconsistencies and increasing the risk of errors.
- Charts and graphs are manually recreated for each update
- Data changes require reformatting across multiple documents
- Inconsistent visuals weaken brand credibility
- Version control issues lead to errors and rework
- Manual processes increase compliance risk
The problem: inefficient workflows, inconsistent outputs, and charts you can’t fully trust.
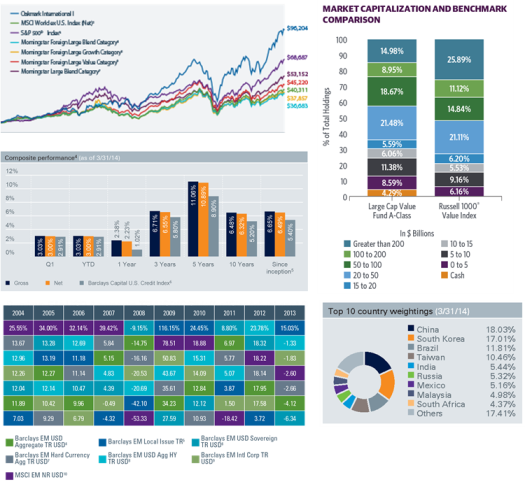
Automate Charts and Graphs with Synthesis
Synthesis transforms how firms create and manage charting and graphing—replacing manual design processes with dynamic, scalable automation and real-time data updates.
Generate charts instantly using real-time investment data, ensuring every visualization is accurate, compliant, and aligned with your brand.
- Automated charts and graphs powered by validated data
- Charts update automatically when underlying data changes
- Produce thousands of charts and graphs in minutes
- Fully customizable to your firm’s design and reporting needs
- Support for all chart types: performance, allocation, growth, and more
From standard fund performance graphs to highly customized visualizations, Synthesis delivers flexible, scalable automation.

One Source of Truth for Automated Charts and Graphs Across Every Channel
With Synthesis, charts and graphs become reusable, data-driven components that scale across your entire organization.
Ensure every chart is consistent, compliant, and accurate—whether it appears in fact sheets, pitchbooks, websites, or board materials.
- Brand-consistent charts and graphs across all outputs
- Built-in data validation and compliance controls
- Eliminate manual reformatting and version control issues
- Zero chart-related compliance errors
- Scale across thousands of documents without increasing effort
The result: faster production, 100% consistency, and automated charts and graphs you can trust—every time.