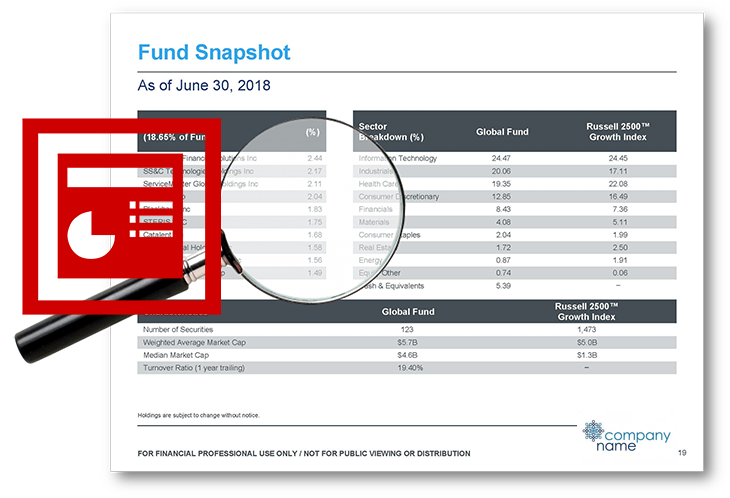
Automated Data Visualizations
We love creating unique charts and graphs that tell your data story in a way that is accurate and visually exciting
Talk to an Expert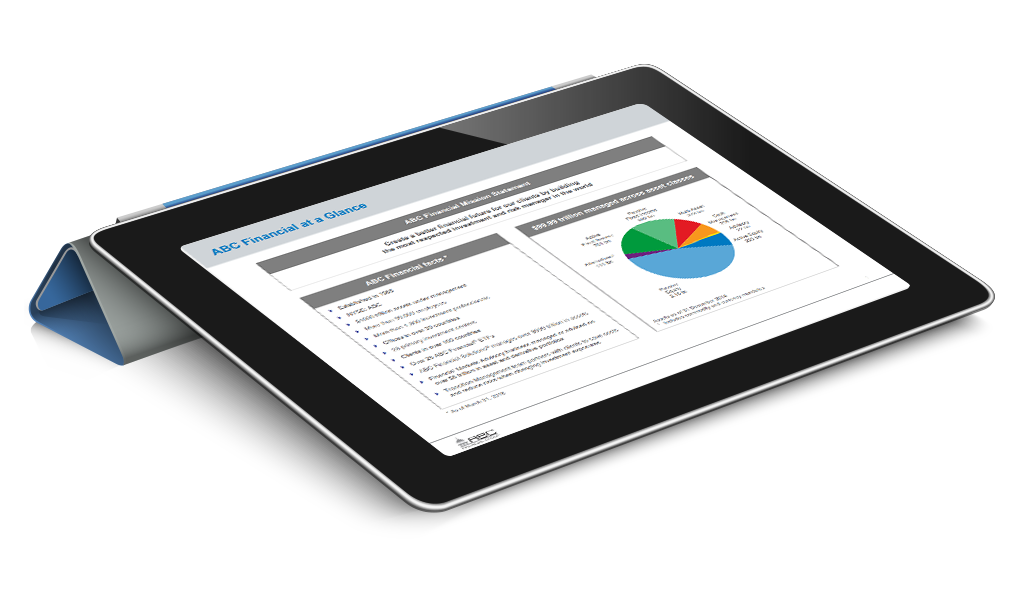
With our tools and experience, we create smart and adaptable charts and graphs to meet virtually any design or reporting requirement. Synthesis’ processing engines for data visualizations are capable of producing thousands of automated charts and graphs a minute. Plus, they are 100% customizable to client specs. Have a really unique chart or graph that is specific to your firm’s product offerings and value proposition? No problem. The charting capabilities we offer are so strong we have clients who use us for this expertise alone.
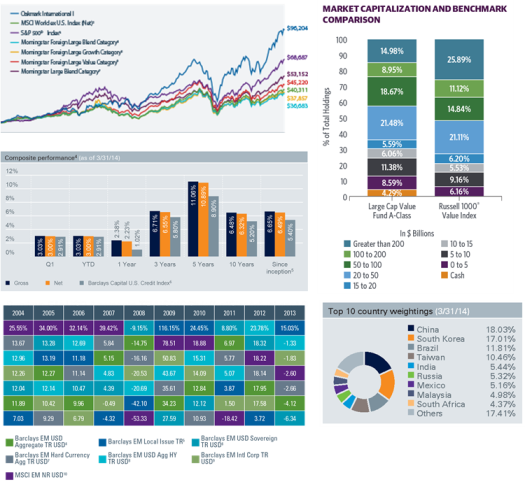
Our data visualization capabilities are unmatched in the financial services industry. Our base library of charts includes multiple variations of:
- Pie charts
- Mountain charts
- Line charts
- Growth charts
- Bar charts
- Scatter charts
- Map charts
- And more

Asset management marketers don’t want to be limited to what’s out of the box when it comes to data visualizations. To meet this need, our automation solution creates beautiful data components in a variety of charts and graphs, or to the client’s unique specifications. When put in combination with our investment data management solutions, the resulting charts and graphs are data-driven, accurate and compliant. When your asset management marketing team has our powerful automation solution at their fingertips, they can focus on growing your firm’s AUM while reducing costs.