Getting the Data Right in Investment Commentary: An Interview with Susan Weiner, CFA

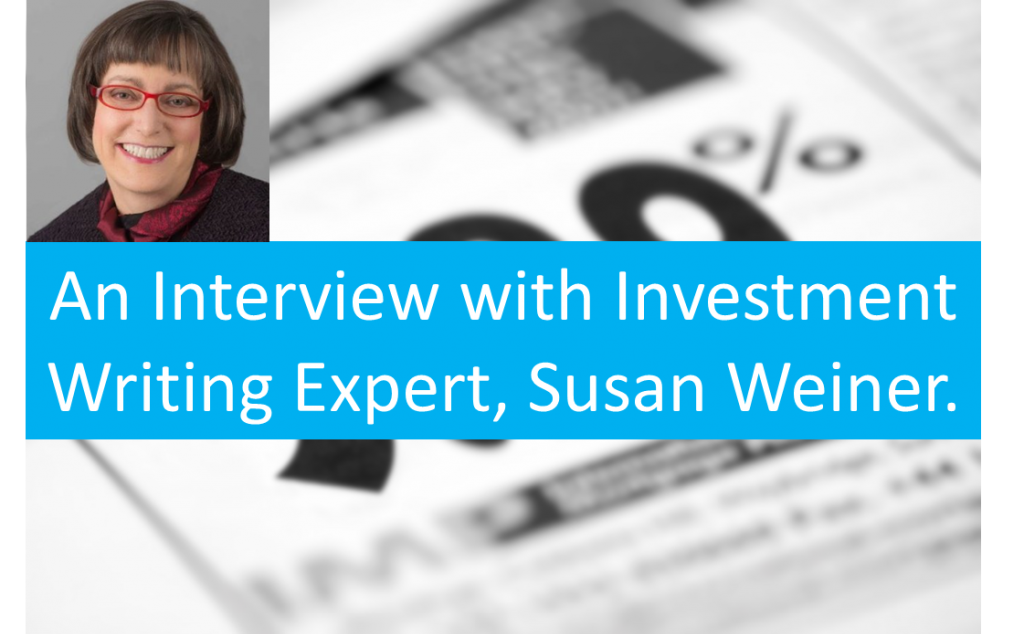
A few weeks ago, my friend Susan Weiner published “Investment commentary numbers: How to get them right.” It’s an excellent blog post about how to prevent numerical errors from being published in investment commentary. Susan is a financial writer-editor at InvestmentWriting.com and author of the book, Financial Blogging: How to Write Powerful Posts that Attract Clients. As a former investment marketing professional turned financial writing consultant, she is no stranger to the intricacies involved in producing these important documents. You can follow Susan on her blog, Twitter, or LinkedIn.
In her article, she recalls a recent experience where a data error was published in a firm’s Q3 commentary, even though four different people proofread the document before it went to print. This has undoubtedly happened to every marketing professional at least once in their career. Human error is inevitable; the eye reads what it expects to see. This mistake prompted her to develop a list of best practices for improving the chances of catching numerical errors in these quarterly reports before they are published and distributed to clients.
Last week, I caught up with Susan to ask her some more questions related to her experience and hear her perspective on how automation might play a role in reducing these pesky data errors.
Q&A with Susan Weiner, CFA
Emilie: Susan, thank you for sharing your experience on your blog. I know these situations are painful for everyone involved. In this particular situation, was the investment firm using any kind of automation, or was this a completely manual process?
Susan: It was completely manual. That’s a very interesting question, though, because I was once on a team that tried to automate the market commentary process, and that was difficult. However, I think something like portfolio performance commentary might be easier to automate, or at least partly automate. Market commentary might include different types of data from period to period, and it doesn’t always take the same format. For example, one time, you might lead with a general overview of the market. Another time, you might go straight into portfolio performance. I think it’s more difficult to automate because it is partly an art. I do think automation can help by automating the accompanying exhibits, like graphs of portfolio versus benchmark returns, or a list of the biggest contributors or detractors. That can help the person who’s doing the writing because they can fact check what they wrote versus what comes up in the accompanying exhibits.
Emilie: That’s a great point. The level to which the document can be automated may vary based on the type of data and the sophistication of the firm’s data management system. Leveraging technology to get these documents out as fast as possible with the fewest errors is the end game. In your experience, what are the most common data or data point errors you see in commentaries and other quarterly reports?
Susan: Any time you have manual data entry, there’s potential for mistakes, especially if you’re reading off of a long spreadsheet with lots of numbers. That being said, I think the most common errors are going to be those where there’s no official data source. If you have an official or approved source, there’s a place that you can go to check those numbers. This should be pretty easy to do if they are numbers that you consistently use quarter to quarter. But what if there’s some economic statistic that’s maybe used only once over the course of the year? Then you may be wondering, what’s the official number?
Emilie: Who should determine where that official source is, or where those numbers will be housed? And who decides what numbers are official?
Susan: That’s going to vary a lot by firm. It might depend on the size of the firm, for example. At a small firm, it might just be just one person who is doing all of the functions, so the owner might be the decision maker on all of that stuff. That is, if the person even has time to think about something like, “What’s an official source?”
But for data like benchmark returns, for example, it might be the performance measurement group that owns those numbers. However, when it comes to deciding what the official source is, there are multiple people who have an interest in this decision. So, I would think that they would want to get all of the affected parties together to discuss deciding on the official source.
Emilie: In your blog post you mention that data inconsistencies often happen because the numbers are coming from different sources, and those numbers may not match. Why does this happen? How do firms usually handle these issues?
Susan: There are different systems that are used, and that can throw off benchmark numbers, for example. One system might handle attribution analysis, and another might do performance measurement. Let’s say that somebody is using the attribution analysis in their results, and they’re just using it for internal purposes to determine what really drove performance. For internal purposes, it might not be particularly significant if the benchmark number is a few basis points off from the official number. This becomes a problem when people start pulling those benchmark numbers from different sources into an official document that has wider distribution and is shared with the outside.
For example, if you’re talking about economic growth in Europe, it’s much harder to say what the official source is. The individual portfolio manager who’s citing the number may have a broad array of statistics to choose from. Because of this, the firm should have standards in regards to their data sources to ensure the data is consistent across all documents. This is where having one approved source for each number pays off; it forces consistency. Another issue to consider is what happens if your data source makes a correction? That’s not uncommon.
Another example is if there was a pricing error at a company that makes up a large part of an index, which can then throw off the returns. There needs to be some kind of internal process for spreading the word about the correction.
Emilie: Not to mention the issue of monitoring or tracking who made the change and why. That would be very important for auditing purposes. Creating a “single source of truth” and providing tracking are two areas of concern we see on the data management front. In your blog post you mention two different tactics for proofing and fact checking quarterly reporting documents. If you had to give an estimate, how much time and resources does this manual QA add to the production process?
Susan: It’s hard to say because the amount of time is going to vary based on the complexity and the length of the document. The best way to get an estimate is to proofread and fact check a representative document. It’s always good to have multiple people involved, because different people catch different things. You know, some people are more attuned to what’s going on in the benchmarks. Others are better at looking at, “Okay, here’s where it says in the Excel spreadsheet, and I’m going to notice if it’s even one basis point off in the publication.”
Again, this is an area where there’s a difference based on the size of the firm, as larger firms can have more levels of review, making it much more likely to catch the errors. For example, when I wrote institutional performance reports for a large institutional money manager, they had many of levels of review. There was my own review, then at least two levels of subject-matter expert review, an official proofreader, and then a review by the client service staff. All of these review steps increase the likelihood that things are going to get caught. Still, even then there’s no guarantee because the eye sees what it expects to see. So if it’s not a big, outrageous error, like the stock market crashed and your piece says the S&P was up 40%, it’s quite possible that nobody will catch it.
Emilie: Even though we provide the technology and services to help our clients’ automate fact sheets, commentaries, etc., we still encourage them to QA their documents. So, the question becomes how much human QA is necessary with the automation in place? What’s the best practice there?
Susan Weiner: It can’t hurt to do another round of checking, although it might not be necessary to check all the numbers. What may be easier and deliver a higher ROI is to check numbers directionally. For example, take a quick look to make sure that the benchmark returns are all in the right number, or eyeball the list of top contributing sectors to make sure it squares with what you’ve seen.
Another example is when I’m writing commentary based on data, and I look at the related graphics to make sure that my work is consistent with them. If by some chance there was a faulty number in this automatically generated graphic, then I might catch it.
Emilie: From your perspective what’s the biggest benefit of using automation to produce documents like investment commentaries?
Susan: When writing commentary, I’ve seen the accompanying graphs and exhibits generated using automation. It helps. I can use those exhibits to check my work. However, I haven’t seen a lot of automation in terms of feeding data into the first draft of my report, so I can’t comment on that specifically.
Emilie: At what point do you think it makes sense to start using automation?
Susan: I think as soon as you can reduce the amount of manual data entry, there’s going to be a big improvement in accuracy. As soon as it’s cost effective, I’d like to see that. I’d hope that at any level of firm, they would generate exhibits with the minimum amount of manual intervention, so that you’re producing your charts and graphs from a data feed instead of typing in the numbers.
Emilie: Let’s talk about the true cost of these errors. In the scenario from your blog post, the cost was a re-print. As you mentioned, it could have been worse if the commentaries had been distributed. What are all the potential costs associated with these data errors?
Susan: There’s loss of credibility. Clients and prospects wonder, “Oh, if you can make this error, are you making other errors?” They wonder if you’re not maximizing their investment return for the level of risk that they’re taking. They may wonder if you’re calculating their fees accurately or overcharging them.
Also, as soon as you catch an error, it slows down the process. That hurts because everybody wants their reports right away. The thing with these commentaries, reports, and fact sheets is you can never get them out fast enough to satisfy the people in the field.
Emilie: Isn’t that the truth! Are there any other stories that you can share in terms of lessons learned or success stories about getting the data right in these reports?
Susan: Another point I’d like to make: to the extent that an investment management firm can provide data to its writers in an easy-to-absorb format, you lessen the possibility of errors. I once suggested a change to a client to help reduce the possibility of errors. In this case, the client gave me its list of biggest contributors and detractors in alphabetical order in an Excel spreadsheet. Then, I had to go in and manually reorganize to figure out which were the top contributors and which were the top detractors. I could have made a mistake when I reorganized the data, right? So, I asked if there was an automated way that they could start generating the data in the order from biggest contributors to biggest detractors. Automating the report wouldn’t take them anymore time, but it would save me time, and undoubtedly increase my accuracy.
Emilie: That’s a really good example. So, did they take you up on your suggestion?
Susan: Yes.
Emilie: That’s great. What was the size of this firm? And was that a difficult request as far as getting it done?
Susan: It was a large firm, and it didn’t happen right away. I think Marketing or Communications had to put in a request and go through some process to get it approved.
Emilie: One of the things I’ve learned from talking to marketers at investment companies is that it can be frustrating to get reports. Often times, they’re not able to pull their own reports and have to wait for someone to fulfill their request. Can you comment on that at all?
Susan: From my experience working on the marketing side, it can be difficult to get the attention of the people who produce the data. Marketing might not be the highest priority, so you may not have the highest clout. When I worked on the marketing staff, if I wanted something for performance measurement, I would sometimes go and hang over the desk of the person who could produce the data for me to make it that much more likely that they would help me. Eventually the performance measurement folks moved into a different building. I was so bummed because it just wasn’t practical anymore to visit them in person.
Emilie: Any final words of wisdom for our readers?
Susan: There’s a quote from George Bernard Shaw that says, “Success does not consist in never making mistakes, but in never making the same one a second time.” I think it’s a great idea to have a process for preventing the occurrence of errors. If something happens, learn from it and incorporate the lesson into your process. You can’t anticipate all of the things that are going to happen. You have to learn from your experience as you go along.


-
 The Future of Asset Management Marketing: 8 Takeaways from Our Fireside Chat with CMO Lara Hoffmans, CFA
 -
7 Problems With Automating Factsheets In PowerPoint
-
 The Growing Importance of ADA Compliance for Investment Companies
 -
Four, No FIVE things to Look for in a Content Automation Solution
-
10 Best Practices for Tailored Shareholder Report Design
Video: Who is Synthesis?

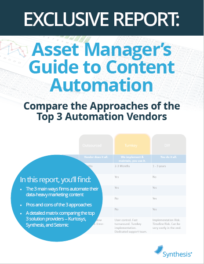 Compare the Top 3 Finserv Content Automation Vendors [White paper]
 Create Pitchbooks the Drive Sales [White paper]
 Build vs. Buy: Should Your Financial Services Firm Outsource or Insource Marketing Technology? [White paper]
  10 Tips for Rebranding your Fund Marketing Documents [White paper]