Designing with Raster vs. Vector Images

Vector, GIF, Illustrator, TIFF, JPEG, PNG, EPS, Raster, PSD – what does it all mean?
With so many graphic formats one can use these days, how do you know which one to use for your project?
In this post, I will explain what the differences are and how you can put this knowledge to use. The two categories of image types we will discuss here are raster images and vector graphics.
What is a Raster Image?
Raster Images are pixel-based– you may already know most of them: GIF, JPEG, PNG, TIFF (and sometimes EPS) are the most common formats used today.
| Raster Format | Color Space | Characteristics |
| GIF (Graphics Interchange Format) |
Indexed | Best used for images containing text, flat color or images with 256 or less colors, supports images with a transparent background |
| JPEG (or JPG) (Joint Photographic Experts Group) |
RGB | Photographic (continuous tone) images, millions of colors, no transparency |
| PNG (Portable Network Graphics) |
RGB | Photographic (continuous tone) images, supports image transparency in millions of colors |
GIF, JPEG and PNG are the most universally accepted image formats for the web and screen presentations.
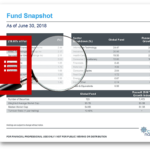
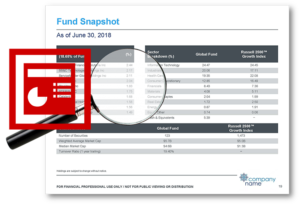
![]() These images are usually low-resolution (or screen-resolution of 72 pixels per inch). Raster images have a fixed number of pixels in them. The image to the right is a 100 pixel x 100 pixel jpeg image at 72 pixels per inch. This means that the image has 10,000 pixels to work with. This number of pixels will never change for this specific image file.
These images are usually low-resolution (or screen-resolution of 72 pixels per inch). Raster images have a fixed number of pixels in them. The image to the right is a 100 pixel x 100 pixel jpeg image at 72 pixels per inch. This means that the image has 10,000 pixels to work with. This number of pixels will never change for this specific image file.
Each pixel is a single point of the image that contains only one color. So when viewing a photographic image on a computer screen, it is actually a series of points that your eyes and brain mix together to produce the appearance of a full color image.
Designing with Raster Images
The diagram below shows the example image with close-ups of the pixels. Looking at the 7x enlargement on the diagram, you will see how I took the original image and tried making it larger. Why does it look so bad?![]()
Well, we’re still working with only 10,000 pixels here. So enlarging the 100 pixel wide image to 700 pixels wide spreads out these pixels, resulting in an image of only about 10 pixels per inch.
By enlarging this image I have reduced its resolution. This is why the quality of a raster image degrades when enlarged. Degradation of the image quality can also happen when the image is reduced. Again, the same number of pixels are in the image, but the result can possibly look just as distorted my making the image look over-sharpened.
Resizing an image (also known as scaling) in your document is not the same as resampling (performing math to add or subtract pixels in relation to the image’s size).
The bottom line: It is very important when working with images for the web and screen presentations that the image file you plan on using is sized exactly to the dimensions to be displayed in the final output in order to maintain the best image quality.
What is a Vector Image?
In contrast to raster images, vector graphics are not pixel-based and the most commonly used vector graphic format is EPS (Encapsulated PostScript). Vector graphics are typically used in documents that are intended for offset printing as well as PDF distribution.
Vector graphics are created using geometric shapes, lines, points, polygons, and Bézier curves that are based upon mathematical expressions. These graphics contain paths which have vectors (a specific X and Y coordinate) relative to other vectors in the image. Vector graphics may contain simple flat colors or may have more complex gradients and shading.
Designing with Vector Images
The advantage of using a vector graphic is that it can be enlarged (or reduced) infinitely without any loss of quality. See the diagram below.
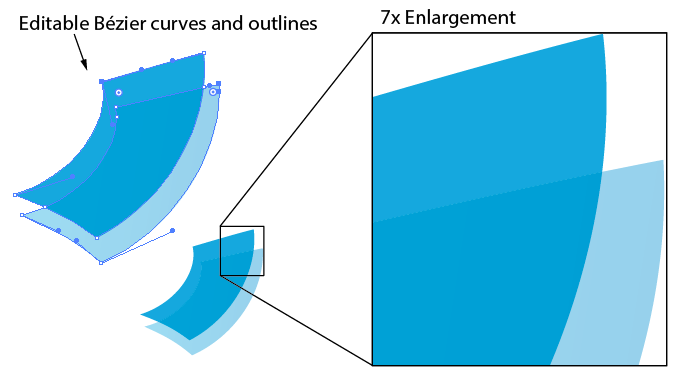
As you can see, there can be few or many vectors on the image. If the image has a curve, they have handles that are used to make adjustments to its shape. Looking at the 7x enlargement, you can see that there is no loss in quality when the image is enlarged.
It is also possible to embed a raster image inside of your vector-based graphic. This method however, is not a best practice and does not convert the raster image into a vector image. It simply means you have an EPS file containing a raster image inside of it. An embedded raster image is also subject to the same image quality consequences when it comes to enlarging or reducing the graphic.
A raster EPS image?
Why YES – there is also a Photoshop EPS format. Photoshop natively creates a raster (pixel-based) image, however, it does have a few vector-based features where editable Bézier curves and outlines can be created, saved and exported as a clipping path in the EPS file. This technique is widely used in print production to “cut out” a photographic image from its opaque background and export it with a transparent background. Like other raster images, Photoshop EPS also has a fixed number of pixels and is subject to image quality consequences when it comes to enlarging or reducing the graphic.
A note about PDF documents
You should consider the intended use of your PDF documents, like fact sheets and commentaries. If the document is meant for electronic distribution and printing on a laser printer, using any combination of the formats described in this article are acceptable. If the intended use of the PDF is for offset printing (printing press), then logos and graphics should be made with vector graphics or high-resolution images such as TIFF or Photoshop EPS.
Conclusion
Whether for web, print or PDF, you now have the tools to identify which format will work best for you. Remember, raster images are limited to a specific number of pixels and vector graphics can be resized without restriction.
If you’re looking for design pointers for your fund fact sheets, commentaries, or other investment marketing documents, feel free to contact us at [email protected]. Happy designing!
Did you like this post? Please share! You can also subscribe to our blog.


-
 The Future of Asset Management Marketing: 8 Takeaways from Our Fireside Chat with CMO Lara Hoffmans, CFA
 -
7 Problems With Automating Factsheets In PowerPoint
-
 The Growing Importance of ADA Compliance for Investment Companies
 -
Four, No FIVE things to Look for in a Content Automation Solution
-
10 Best Practices for Tailored Shareholder Report Design
-
 The Future of Asset Management Marketing: 8 Takeaways from Our Fireside Chat with CMO Lara Hoffmans, CFA
 -
7 Problems With Automating Factsheets In PowerPoint
-
The Growing Importance of ADA Compliance for Investment Companies
-
Four, No FIVE things to Look for in a Content Automation Solution
-
10 Best Practices for Tailored Shareholder Report Design
Video: Who is Synthesis?
Premium Resources
 Compare the Top 3 Finserv Content Automation Vendors [White paper]
 Create Pitchbooks the Drive Sales [White paper]
 Build vs. Buy: Should Your Financial Services Firm Outsource or Insource Marketing Technology? [White paper]
  10 Tips for Rebranding your Fund Marketing Documents [White paper]
Recent Posts

Video: Who is Synthesis?