What is your ROI on producing marketing content?

It’s easy to underestimate what it costs to run your marketing operations. For asset managers, producing content is not an easy task. The materials are data-heavy, constantly changing, and usually go through several rounds of review. Creating a streamlined process is critical to realizing a return on investment. But how do you measure it?
There are three steps to building a solid ROI calculation, and the first step is to understand your true organizational production costs. Very few people know how to really measure this. Most of the time, managers simply look at their departmental head-count (FTE) cost and estimate what percentage of their time goes into updating and distributing content and literature. This broad-brush approach would seem to capture the costs well but often results in a gross underestimation of the true costs. A full accounting should cover direct labor costs, managerial labor costs, opportunity costs, and error and risk-related costs.
We’ve had two clients undertake a full and detailed Six Sigma cost analysis of their baseline costs and risks associated with manual or semi-automated literature production. The results were staggering.
The Six-Sigma Analysis
One client, who at the time was producing only about 60 quarterly factsheets of various types, was shown the potential to save nearly $44,000 per quarter due to increased efficiencies and reduced labor and staffing burden. That figure included the cost of adding a high-end automation platform. Their team was not huge and their process was not bloated. This cost figure came from understanding every single touchpoint, discussion, meeting, review, re-do, and late hour put into their literature maintenance. It also quantified the opportunity cost of other work that could be done if literature production wasn’t hanging over the team’s head. (It did not, however, take into account the estimated cost of FINRA-levied penalties potentially charged for errors or compliance issues.)
Without conducting a full six-sigma analysis of your organization, we can provide some rules of thumb and simple formulas to help you establish your baseline departmental costs with a more comprehensive set of considerations.
Direct Costs (DC)
To get your full enterprise costs for producing content, you must first calculate your direct costs.
Calculating direct costs (DC) is based on two factors:
1) The number of Full Time Employee (FTE) equivalents required to produce your literature. We’ll label this FTE count as “X”.
2) The average fully-loaded cost of these staff members. We’ll call this average staff-member cost “Y”.
Counting staff members is easy. Calculating the percentage of their time going into literature production and maintenance is much more difficult. Most managers underestimate this percentage. It’s very easy to overlook all the time and energy costs such as distractions, task switching and even employee turnover. That being said, we recommend skipping the percentage guestimate altogether. We’ve developed a rule-of-thumb ratio through observation of a large sampling of asset management companies.
In a non-automated scenario, we recommend considering at least one FTE per thousand pages of product literature produced annually.
If your ratio is below this, then you probably either have some automation in place, have very simple documents, or are working your staff out the door. Note that these are not full-time positions for literature maintenance. There may be four people on your staff, but they all work part-time on literature, the accumulation of all that part-time effort should make up about one FTE per thousand pages as described above. Also, don’t forget the designers and other production team members who may be outside your department head-count. Those resources are factored into this ratio as well.
Fully-loaded cost for marketing team members is variable, of course, but you’ll need to be sure you include full labor and overhead costs in determining this cost of labor. We recommend averaging the salaries of the team members (not including management) involved and then multiplying that figure by a factor of between 1.38 and 1.45 in order to estimate their full cost including benefits, bonuses, staff management, overhead, office space and recruiting/HR costs. (At some companies in expensive labor markets or with high overhead costs, this ratio can easily be 1.5x. In Europe it can be 1.7x or higher.)
So, to calculate the Direct Costs (DC) associated with literature production, simply use the formula X * Y = DC.
For example, at 1 FTE per 1,000 pages, if I have 2,400 pages, that’s likely 2.4 FTE for literature production. If my average fully-loaded annual cost per marketing FTE is $112,000, then my annual direct costs (DC) are 2.4 x $112,000, or $268,800k per year.
Indirect Costs (IDC) or “Hidden Costs”
Next comes the more hidden cost element: Indirect costs (IDCs).
IDCs are the “hidden costs” affecting your organization: the amount of management time, opportunity cost, extra-departmental and intangible costs that go into planning, proofing, reviewing, checking and re-checking materials and re-doing things at the last minute. Think of all the planning meetings and discussions about the team and process at a higher level. Consider every team meeting, hallway conversation, phone call, discussion with compliance, late-night fire-drill and scramble caused by an error. Imagine the costs of the IT team, accounting, and temp staff. Consider the costs of the data analytics teams which provide you with numbers. Then, consider your own team’s costs in gathering and checking those numbers. Think of the time running back and forth to get corrected numbers. Think of all the work that simply wouldn’t happen if the literature didn’t exist, across the whole company!
As a rule-of-thumb, we recommend putting your indirect costs at 60% to 80% of DC. So, yes, essentially double your base-line assumption about what literature production and support is costing you. Sometimes, for larger more complicated businesses, this IDC can be well over double the DC costs. Some companies need five meetings with ten people in each before dealing with documents and compliance rules. So, while perhaps not precise, these rules represent a valid framework to quantify overhead costs in supporting marketing document production.
The True Cost Formula: DC + IDC = FEC
Once you’ve determined your direct and indirect costs, you have what you need to calculate your true operational cost. Direct Costs (DC) + Indirect Costs (IDC) = Full Enterprise Cost
For example, if my DC was $268,800 per year, and I calculate my IDC conservatively at 60% of this ($161,280k), then my FEC of supporting 2,400 pages of literature is $268,800 + $161,280 = $430,080 per year (not including any print and fulfillment costs).
This completes step one in figuring out your ROI and building a cost justification for an automation solution.
Getting to ROI: What’s next?
Once you’ve completed step one to determine your Full Enterprise Cost (FEC), you’ll need to understand the growth model for these costs. Decisions like this should be projected out over 3 or 5 years to create a full picture, taking into account all of the content you’re producing today as well as the projected product, page count, and staff growth. After creating this projection model, evaluate the different approaches for automation, including DIY, outsourced, or a hybrid. The cost of each approach should take into account the full cost of the automation program. This includes client services and support fees. It must also factor in how the automation solution affects your staffing requirements and FEC with the automation in place. Once you’ve determined these figures, you can get to an “FEC with automation” figure, and compare the costs by automation vendors or approach to determine the best ROI.
Final tip: When evaluating technology purchases, take care not to minimize current operating costs or estimate facts to suit your personal bias. If you under-represent your cost of operations, you’re going to find yourself atoning for these decisions when reality hits. Don’t be afraid to represent true costs; it will be important when you go to build an ROI justification for a content automation purchase.
Want more details on how to calculate ROI on your document production? For a detailed walk-thru of the three-step process of building an ROI calculation to justify an automation decision (including examples and math equations) simply request a copy of our white paper: How to Illustrate ROI on Content Automation. We’d be happy to send it to you!
Share this post if you liked it! You may also subscribe to our blog to be notified when new posts are published.

-
 The Future of Asset Management Marketing: 8 Takeaways from Our Fireside Chat with CMO Lara Hoffmans, CFA
 -
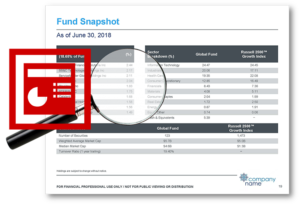
7 Problems With Automating Factsheets In PowerPoint
-
 The Growing Importance of ADA Compliance for Investment Companies
 -
Four, No FIVE things to Look for in a Content Automation Solution
-
10 Best Practices for Tailored Shareholder Report Design
Video: Who is Synthesis?
 Compare the Top 3 Finserv Content Automation Vendors [White paper]
 Create Pitchbooks the Drive Sales [White paper]
 Build vs. Buy: Should Your Financial Services Firm Outsource or Insource Marketing Technology? [White paper]
  10 Tips for Rebranding your Fund Marketing Documents [White paper]